|
|
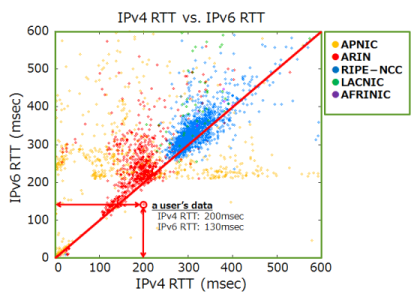
This is a plot of RTT information by dual stuck users.
|
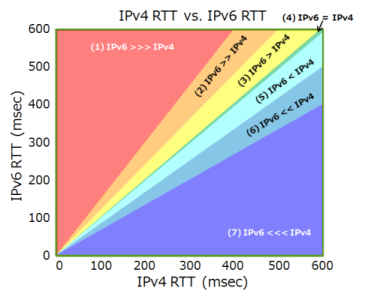
This graph shows spliting the plot in seven areas.
|
|
|
|
This is a plot of RTT information by dual stuck users.
|
This graph shows spliting the plot in seven areas.
|